
Healthcare's $5.3 Trillion Drag
How Medical Spending Became America's Biggest Productivity Tax
Government shutdown over ACA subsidies masks deeper crisis: healthcare sector consumes 18% of GDP, heading to 25%, functioning as a 20% tax on productivity while wages stagnate
The 36-day government shutdown over $350 billion in healthcare subsidies has Wall Street pricing in familiar patterns—political theater masking structural rot. Markets shrugged it off: the S&P 500 Healthcare Index has started to reverse the pressure it had been under since the summer. The expectations are that Congress will blink before premium shock hits 24 million Americans.
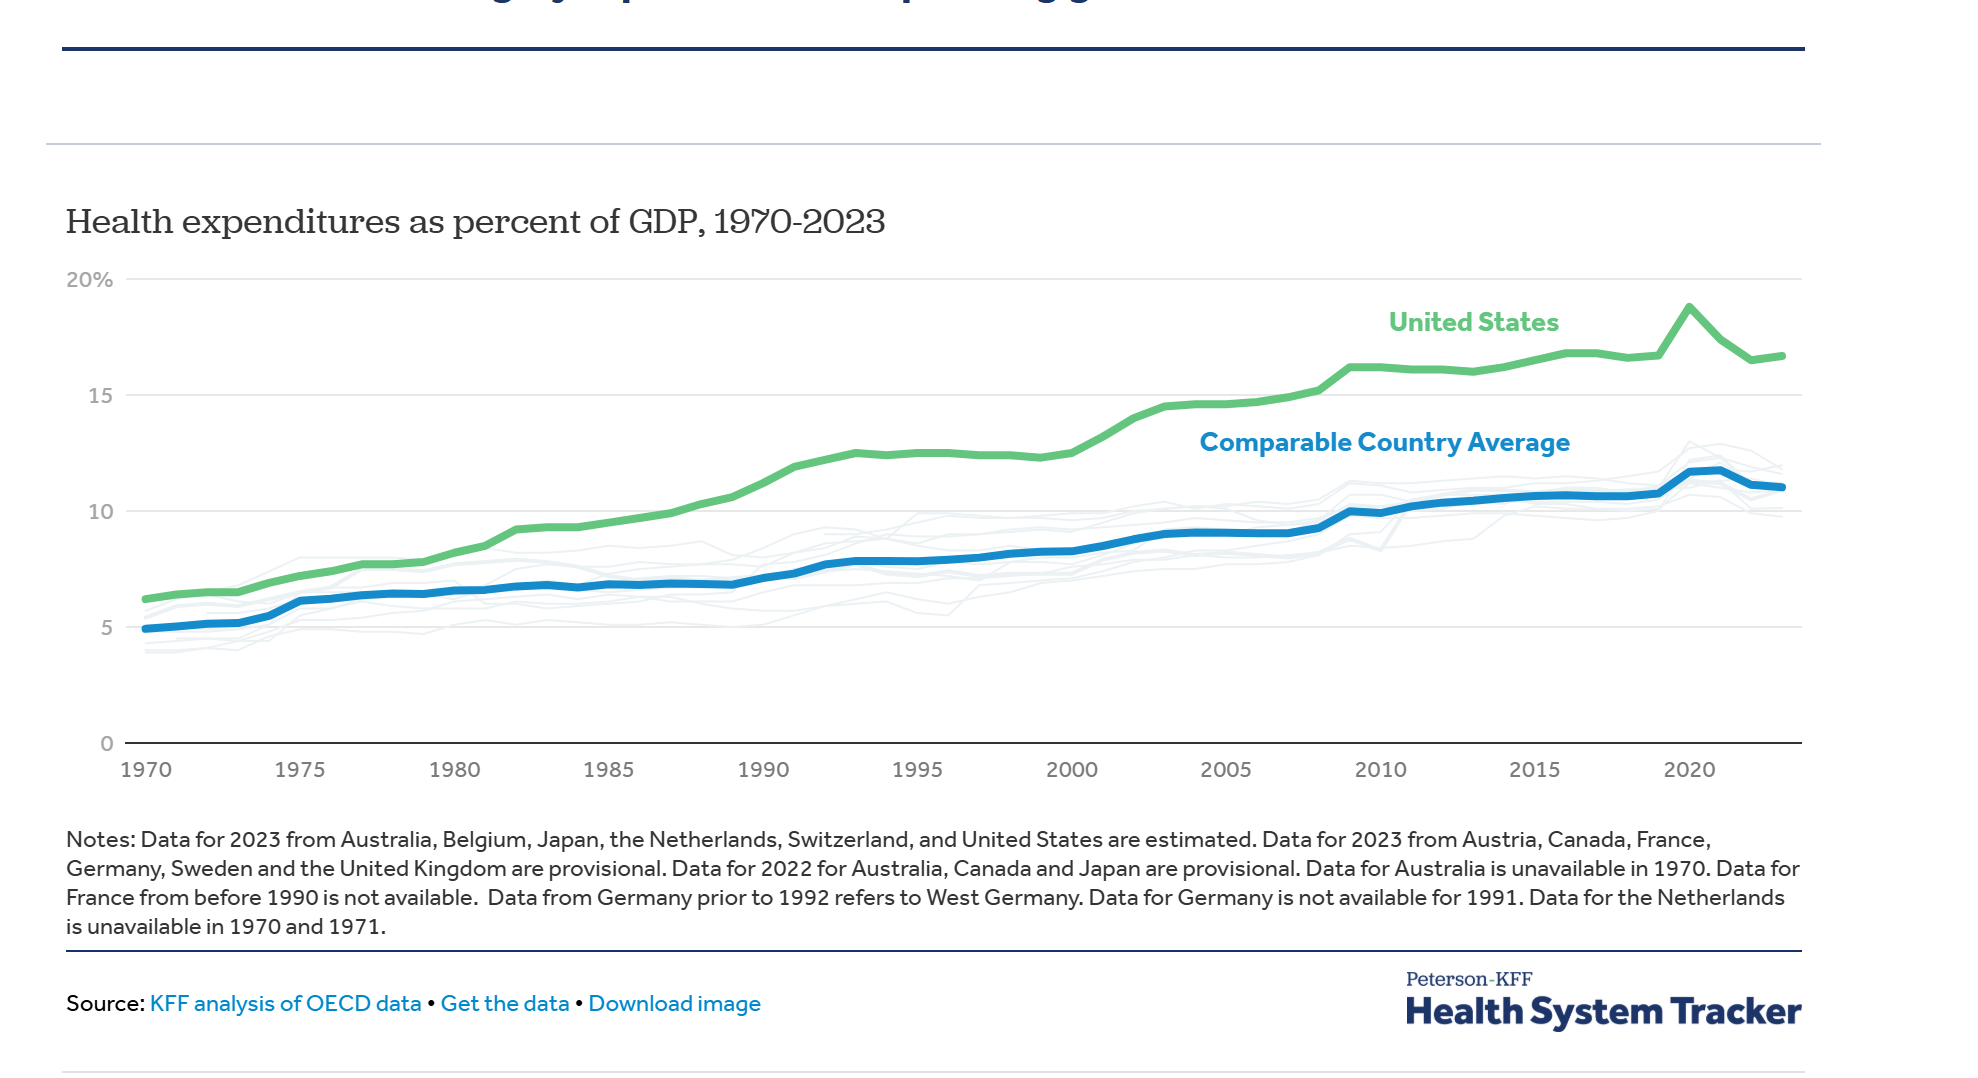
But the real story isn't the subsidy fight. Healthcare spending hit $5.3 trillion in 2024, grew 8.2% while GDP expanded 5.3%, and now functions as a mounting tax on American productivity. The sector consumed 5% of GDP in 1970. Today: 18%. CMS actuaries project 20.3% by 2033. Current trajectories point to 25% by 2040—one quarter of economic output absorbed by an industry delivering outcomes ranking behind peers spending half as much per capita.
SPONSORED CONTENT: Today's Report is brought to you by Section.

Free event: Learn How to Raise Your Company's Value with AI - November 20
Find out how to raise your company's value with AI. Join Section on 11/20 from 12-1pm ET as they pick the brain of a consultant who used AI to 5.5X the value of his company.
"On average, we're expecting premium payments by enrollees to increase by 114% if these enhanced tax credits expire," says Cynthia Cox, director of the ACA Program at KFF. That's $888 in 2025 jumping to $1,904 in 2026. The Congressional Budget Office estimates 4 million will drop coverage when premiums double November 1st.
The arithmetic is mechanical: healthcare spending growth averaging 5.8% annually through 2033 versus GDP growth of 4.3%. That 1.5 percentage point differential compounds relentlessly. Each year, healthcare claims a larger share, leaving less for wages, investment, innovation. For equity markets, this matters. Healthcare represents 13.1% of S&P 500 market cap—$4.2 trillion exceeding Germany's entire GDP. But the sector's growth comes at other sectors' expense.
The wage data reveals the mechanism. In 1970, wages commanded 59% of GDP while healthcare took 7%. Today: wages at 52%, healthcare at 18%. The inverse correlation is perfect—every percentage point healthcare gains, wages lose. This isn't coincidence.
Tufts University analysis estimates families with employer coverage missed $125,000 in potential earnings over three decades as premiums grew from 7.9% to 17.7% of total compensation. Every dollar diverted to premiums is a dollar not paid in wages. This isn't a healthcare story—it's a productivity story, a competitiveness story, a living standards story. And markets are mispricing the risk.
When "Medical" Became "Healthcare": The Industry That Didn't Exist
In 1970, Americans sought "medical care"—episodic treatment delivered by independent practitioners. Community hospitals operated on thin margins. Insurance covered catastrophes. The sector consumed 5% of GDP, comparable to peer nations.
Through 1985, "medical costs" had started to become an important topic of discussion. The industry needed a rebrand. Healthcare had a better ring to it than medical - more human, more whole; most importantly more profitable.
Reagan's 1980s pullback from government Medicare coincided with aggressive commercialization. The American Healthcare Association planted seeds that would blossom into today's ecosystem. Industry executives recognized health anxiety creates nearly unlimited pricing power. Unlike normal goods with downward-sloping demand curves, healthcare demand proves price-inelastic when third parties pay.
As one industry analysis noted: "Nearly 95% of all Americans do not pay their hospital bills. Third party payors do, and since these payments spread the burden over the population as a whole, the impact of medical cost increases appears minimal to the consumer." Classic moral hazard—patients and providers faced minimal incentive to control costs when someone else paid.
"Outcome-based pricing" emerged as the new paradigm. Keep people healthy rather than treating illness. Sound logic. In practice, it became another mechanism for expanding billable services. Wellness visits, preventive screenings, chronic disease management programs proliferated—each generating revenue while aggregate spending accelerated. By 1990, healthcare had doubled to 10% of GDP.
The Professionalization: Every Reform Becomes Revenue
The 1990s brought full corporate embrace. In 1992 alone, WPP, Grey, and Saatchi & Saatchi consolidated or formed specialized healthcare units. The marriage of medicine and marketing fundamentally altered consumption patterns.
More critically, every cost-control mechanism mutated into revenue stream. Managed care—introduced to constrain fee-for-service excess—created administrative infrastructures adding costs without improving outcomes. HMOs promised to align incentives. Instead, they added bureaucratic layers and generated insurance profits.
Shortened hospital stays resulted in higher per-day charges exceeding length-of-stay savings. Outpatient surgery centers proliferated but aggregate spending rose as procedure volumes expanded. Generic drug substitution created opportunities for pharmacy benefit managers to extract spread pricing while manufacturers developed branded specialty drugs.
The pattern repeated endlessly: identify inefficiency, design intervention, watch healthcare absorb reform and convert it to profit. By late 1990s, healthcare commanded one-seventh of the economy. The industry achieved sufficient scale and political influence to resist reforms threatening growth.
Wage impact accelerated. As employers faced 8-12% annual premium increases through the 1990s, they constrained base wage growth. Between 1988 and 2019, premiums grew from 7.9% to 17.7% of average compensation—explaining wage stagnation better than automation or globalization. The burden fell disproportionately on lower-income workers and people of color, with Black and Hispanic families consistently bearing higher premium burdens.
The Competition Paradox: Why Markets Failed
The US spent $13,432 per capita on healthcare in 2023—$3,700 more than the next highest and double the $7,393 OECD average. Germany spends $7,383, Switzerland $7,179, UK $5,387, Japan $4,666. All deliver comparable or superior outcomes.
A British chief medical officer stated the principle decades ago: "We treat to extend life, not to reduce pain." Britain spent 5.5% of output while keeping populations healthy. A ten-country study ranked the US second in spending, ninth in outcomes. Britain: last in spending, fourth in outcomes.
The NHS achieves this through supply constraints, centralized planning, explicit rationing. Britain's 11% of GDP spending—half the US rate—delivers higher life expectancy, lower infant mortality. British citizens express higher satisfaction despite spending less.
The fundamental difference is competitive dynamics. The British system features vigorous competition for scarce healthcare dollars. Treasury and NHS England negotiate aggressively with pharmaceutical companies, device manufacturers, providers. What Britain lacks is competition among multiple payers maintaining separate infrastructures while competing to shift costs.
The American system inverts this: minimal competition for care delivery, intense competition among payers to avoid cost responsibility. Insurance shields consumers from price signals. The insured patient with fixed copay doesn't care if a procedure costs $1,000 or $10,000. This creates a ratchet: providers charge whatever insurers pay, insurers raise premiums, employers or government bear burdens.
Out-of-pocket cost stability proved crucial. Despite spending's explosion from 5% to 18% of GDP, out-of-pocket expenses for insured Americans remained relatively constant—just 10% of total expenditure in 2023, down from higher historical levels. For the insured majority, inflation's pain manifests through suppressed wages and higher premiums deducted from paychecks rather than direct payments. This diffusion prevents price discipline.
France and Germany achieve universal coverage through multi-payer social insurance yet avoid American inflation through regulation and price controls. Japan combines public insurance with aggressive fee constraints. Each recognizes healthcare cannot function as conventional markets. Information asymmetry, emotional decision-making, third-party payment, and inelastic demand render standard mechanisms ineffective.
The ACA Acceleration: 15% to 25% and Rising
The 2008 crisis might have forced reckoning. Instead, the ACA precipitated the sector's most dramatic expansion. Healthcare stood at 15% of GDP when debates commenced. Proponents argued expanding coverage would control costs through preventive care, reduced emergency use, broader risk pools.
None achieved objectives. Spending reached $4.9 trillion by 2023, representing 17.6% of GDP. Growth from 15% to 18% occurred despite massive intervention designed to control costs. Each ACA mechanism followed the pattern—efficiency initiative becoming revenue opportunity.
ACOs proliferated as vehicles for providers to capture upside while limiting downside. Value-based contracts proved complex, generating consulting overhead exceeding savings. Medical homes created billing codes without improving outcomes. The individual mandate generated backlash and was eliminated, yet spending climbed.
National health expenditures grew 7.5% in 2023, highest since 2003 excluding pandemic. Hospital spending jumped 10.4%, drugs rose 11.4%, physician services increased 7.4%. Spending grew 8.2% in 2024, hitting $5.3 trillion. Growth expected at 7.1% in 2025. CMS projects 5.8% average growth through 2033 versus GDP's 4.3%, pushing healthcare to 20.3% of GDP.
Extrapolating suggests 25% by early 2040s. The $350 billion subsidy fight pales beside aggregate spending projected to exceed $8.6 trillion annually by 2033.
Stacy Cox in Utah saw premiums jump from $495 to $2,168—more than her mortgage. "I don't know if I've ever cried opening a letter from insurance before," she told ABC News. Beth Dryer in Virginia watched her $80 premium quadruple to $425.
Baby boomer demographics drive acceleration. All 78 million enrolled in Medicare by 2029. Medicare spending projected to grow 7.8% annually through 2033—fastest of major payers. Worker-to-beneficiary ratio deteriorating from 3.1 today to 2.3 by 2030. Labor costs increased $42.5 billion between 2021-2023 driven by shortages. Hospital systems compete for staff, bidding up wages with limited productivity offsets.
Market Implications: Mispricing the Productivity Drag
For markets, healthcare's trajectory presents underappreciated risks. The sector's S&P 500 weight of 13.1% makes it systemically important. But the broader drag from healthcare consuming 18% of GDP—heading to 25%—threatens growth assumptions embedded in equity valuations.
Healthcare multiples appear reasonable at 18.5x forward earnings versus S&P 500's 20.1x. But this misses the point. The question isn't whether UnitedHealth or CVS Health are attractive. It's whether an economy devoting one-quarter of output to healthcare can generate 6-7% nominal GDP growth rates markets price into long-duration assets.
The math doesn't work. If healthcare grows 5.8% annually while GDP grows 4.3%, and healthcare already represents 18% of economy, the mechanical drag on non-healthcare sectors approaches 0.5 percentage points annually. Compound that over decades and it's the difference between 2.5% and 3.0% real GDP growth—the difference between stagnation and expansion.
For fixed income, healthcare's claim on government revenues poses fiscal risks. Medicare and Medicaid consume 26% of federal spending. As healthcare reaches 25% of GDP with government programs financing 40% of spending, fiscal arithmetic becomes untenable without tax increases, benefit cuts, or monetary accommodation repricing bonds.
Municipal bonds face concentrated exposure. Hospital systems represent major employers and taxpayers in many jurisdictions. Rating agencies scrutinize healthcare-dependent credits. States face Medicaid pressures as federal matches decline. Hospital closures threaten economic bases and bond ratings.
For currency markets, healthcare represents competitive disadvantage. US manufacturers absorb premium costs foreign competitors avoid. In 1991, manufacturers shouldered $11.5 billion in extra costs—ballooned multifold since. This manifests in trade balances, profit margins, and dollar valuations.
The Utility Solution: Constraining the Unconstrained
The search for solutions confronts uncomfortable reality: every reform over 50 years transmuted into revenue stream. Managed care became overhead. Outcome-based payment created upcoding opportunities. Price transparency generated consulting without reducing spending. Electronic health records added billions without efficiency gains.
This pattern suggests searching for optimal market-based healthcare is fundamentally misguided. Healthcare operates more like utility than competitive market. Citizens require reliable access regardless of ability to pay. Information asymmetries render consumer choice illusory. Inelastic demand defeats price signals.
Utility models imply regulation, supply constraints, explicit rationing—concepts triggering American opposition. Yet the current system already rations through price and insurance status. Millions delay or forego treatment while the insured consume care with minimal price sensitivity.
Constraining the sector's scope represents the most direct approach. Healthcare consumed 5% of GDP in 1970 and delivered reasonable outcomes. Expansion to 18% generated industry wealth yet produced minimal population health improvement relative to peers spending half as much. Returning to modest footprint would free resources for wages, investment, public goods while likely improving outcomes through reduced overtreatment.
Such constraint requires abandoning outcome-based payment dominating reform discussions. The problem with paying for outcomes is definitional complexity creating gaming opportunities. Moreover, industries tasked with delivering outcomes possess every incentive to expand healthcare's domain.
Supply-side constraints offer promise. Limiting hospital beds, regulating procedure and drug prices, capping administrative overhead, restricting technology deployment based on cost-effectiveness could prevent spending growth while maintaining outcomes. Britain, France, Germany, Japan employ various combinations, all achieving universal coverage at half American cost.
The second crucial element involves shifting decision-making to payers themselves—not insurance companies or bureaucrats, but individuals whose resources finance the system. This proves challenging given temporal mismatch. Most spending occurs at life's end when individuals exhausted earning potential.
Other countries solved this through mandatory universal insurance with lifetime guarantees. Citizens contribute during working years, accumulating claims on future care regardless of subsequent status. The system functions as intergenerational transfer—working populations finance current retiree care while building entitlements.
This requires accepting reduced competition for dollars—the competition American healthcare excels at. Multiple insurers competing for members, hospitals competing for patients, pharmaceutical companies competing for prescriptions—each adds administrative costs, marketing, profit margins without improving care. Consolidating into single or regulated payer would eliminate overhead while enabling aggressive price negotiation.
Breaking the impasse requires confronting healthcare's utility-like characteristics. Electricity, water, telecommunications operate under price regulation because natural monopoly characteristics defeat competitive dynamics. Healthcare shares these features—local hospital monopolies, network effects in insurance, patent monopolies for pharmaceuticals.
The path forward involves supply constraints, price regulation, consolidated purchasing—abandoning the fiction that markets can produce optimal outcomes with right incentives. This doesn't necessarily imply British single-payer, though that model's cost-effectiveness deserves consideration. Multi-payer systems like Germany's can function with all-payer rate-setting and global budgets.
What cannot continue is the trajectory toward 25% of GDP consumed by healthcare—crowding out investment, suppressing wages, undermining competitiveness, delivering mediocre outcomes at premium prices. Each year of delay compounds the problem as industry scale and political influence grow.
Trading the Endgame
For market participants, several implications emerge:
Equity: Healthcare sector looks expensive on 5-10 year view if regulatory or fiscal pressures force margin compression. Political risk around drug pricing, hospital reimbursement, insurance regulation underappreciated. Yet, this is an industry that has never lost. Defensive characteristics may not hold for a day or a year, but its likely the sector will bounce back soon enough. Consider reducing overweight or hedging with puts on HMO/PBM names most exposed to margin pressure till a clear direction is established.
Fixed Income: Municipal healthcare bonds require scrutiny given hospital financial stress and potential closures. Federal fiscal pressures from Medicare/Medicaid growth may force tax increases or spending cuts affecting other programs. Long-duration Treasuries vulnerable if healthcare's fiscal drag forces monetary accommodation repricing real rates.
Macro: Healthcare productivity tax depresses potential growth, suggesting markets overprice nominal GDP assumptions. Secular stagnation gains credibility if healthcare continues claiming larger GDP share. Currency implications favor economies with efficient healthcare in long-run competitiveness.
Policy Trades: Subsidy fight likely resolved with temporary extension. But bigger reckoning approaches as boomers age and healthcare hits 20%+ of GDP. Options on healthcare reform becoming viable as fiscal pressures mount. Political volatility around healthcare increases as costs hit critical mass.
The government shutdown over $350 billion in subsidies misses the forest. The real issue is healthcare functioning as 20% tax on productivity, heading to 25%, while delivering inferior outcomes. Until markets price this structural drag accurately, opportunities exist for investors positioning ahead of inevitable reckoning.
Data sources: Centers for Medicare and Medicaid Services, KFF, Congressional Budget Office, OECD Health Statistics, Bureau of Economic Analysis. Market data as of November 5, 2025.