
The End of American Hypergrowth
For two centuries, the US economy grew by adding workers. That's over.
The American economic miracle rested on a simple formula: more workers, more output, more prosperity. Call it the American flywheel.
From the early 19th century through the late 20th, the US economy expanded from 18 per cent of world GDP to 30 per cent by systematically expanding its labour force faster than competitors.
That era has ended.
SPONSORED CONTENT: Today's Report is brought to you by Section.

Free Virtual Event: Raising Your Company's Valuation with AI - November 20
Danilo McGarry took a €900M company and turned it into an AI-first organization worth €4.9B. You'll learn how he did it, the essential strategy, and the hang ups to avoid.
Join Section on 11/20 from 12-1pm ET as they pick the brain of a consultant who used AI to 5.5X the value of his company.
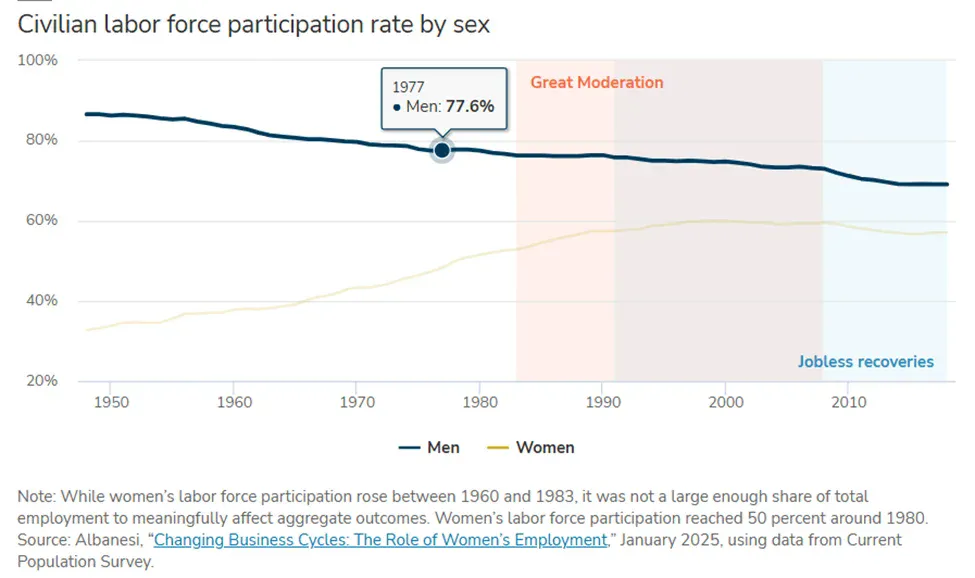
Three demographic forces that powered two centuries of growth have simultaneously reversed. Women's labour force participation plateaued at 61 per cent in 1997 and has drifted to 57.2 per cent as of October 2025. Male participation has collapsed from 83 per cent in 1950 to 68.4 per cent—15 percentage points representing roughly 11m missing workers. Life expectancy gains have stalled while the population ages rapidly. Immigration has been restricted precisely when demographic need is greatest.
According to research publishedrecently by Stefania Albanesi at the Federal Reserve Bank of Minneapolis, just the stalling of female participation has already cost the US economy approximately $2tn in foregone output since 1993. That figure is trivial compared to what's coming.
The research reveals what economists missed for decades: American economic dominance wasn't primarily about superior institutions, better policy, or exceptional innovation. It was about demographics. The US had more workers, added workers faster, and extracted more labour from its population than competitors. That advantage is gone and won't return.
What's left is an economy that must generate growth through productivity alone—and productivity growth has collapsed from 3.0 per cent annually in 1996-2005 to just 1.5 per cent from 2010-2019. The Congressional Budget Office projects potential GDP growth at only 1.8 per cent annually through 2034, down from the 3-4 per cent that prevailed through most of the post-war era.
The hypergrowth that powered American ascendance from colonial backwater to global hegemon is over. The future looks more like Europe or Japan: low growth, aging populations, persistent labour shortages that automation fills, and a slow drift from the centre of global economic gravity.
This isn't gloom. It's structural reality. The demographic dividends that made America exceptional have expired. What worked has stopped working.
The Three-Part Collapse
The US labour force participation rate peaked at 67.3 per cent in April 2000. It stands at 62.7 per cent as of October 2025. That five percentage point decline obscures a more fundamental transformation: the simultaneous exhaustion of all three sources of labour force expansion that powered American growth since the early 19th century.
First: Gender convergence has stopped. Women's participation surged from 34 per cent in 1950 to 61 per cent by 1997—adding tens of millions of workers over five decades. That rise has ended. Female participation now sits at 57.2 per cent. The gap with men is no longer closing through female gains. It's closing through male decline.
Second: The longevity dividend has reversed. Life expectancy rose from 47 years in 1900 to 79 years by 2010, steadily improving the ratio of working years to total lifespan. That trend has stalled. Worse, the additional years aren't productive years—they're years of dependency. The old-age dependency ratio—the number of people 65 and over for every 100 working-age adults—stands at 29 today. The Congressional Budget Office projects it will hit 37 by 2035 and 42 by 2050. Medical costs, long-term care, retirement benefits, all funded by a shrinking ratio of workers.
Third: Immigration has been restricted. Immigration provided roughly 40 per cent of labour force growth from 1990-2020. That flow has slowed dramatically. Both parties now embrace restrictive policies. Public opinion supports reduced immigration. Birth rates have fallen to 1.62 children per woman in 2023—a record low confirmed by the CDC and well below the 2.1 replacement rate. The working-age population will soon shrink in absolute terms.
Historical national accounts data compiled by Robert Gallman shows that US real GNP grew roughly 48 per cent per decade through the 19th century, versus only 13-16 per cent per capita growth. The difference was population expansion. The economy grew by adding workers, not primarily by making existing workers more productive.
That model persisted through the 20th century. Household incomes rose even as individual wages stagnated because families shifted from one earner to two. GDP per capita continued climbing, but much of aggregate growth came from expanding labour inputs—women joining the workforce, immigrants arriving, the baby boom cohort entering working age.
The demographic dividend is now exhausted across all three dimensions simultaneously. For the first time in American history, the labour force cannot grow through adding previously excluded groups, extending working lifespans, or importing workers.
What Hypergrowth Actually Was
From 1800 to 2000, America grew faster than any large economy in history. Real GNP increased roughly 47-fold over that period—an average of 42 per cent per decade when measured in overlapping decades. The economy that began as 18 per cent of world GDP in the early 19th century reached 30 per cent by the late 20th century.
But the per capita story was always more modest. Gallman's data shows 13-16 per cent per decade per capita growth through most of the 19th century. Respectable, but not exceptional compared to other industrialising economies. The hypergrowth was about population, not productivity miracles.
The 20th century followed the same pattern. Post-war boom, Great Moderation, technology revolution—all generated impressive aggregate growth but modest per capita gains once you account for labour force composition changes. Median household income rose substantially from 1950 to 2000, but that primarily reflected two earners instead of one, not genuine per-worker prosperity.
The current stagnation in median household income since 2000 reflects the exhaustion of this model. You can't keep raising household income by adding earners once both adults are already working. You can't keep expanding the labour force by bringing women in once they're already participating at rates approaching men's. You can't keep growing by adding workers once the working-age population stops growing.
American exceptionalism was real, but it was demographic exceptionalism. The US had vast territory, attracted immigrants, maintained high fertility, and finally incorporated women into paid work later than most developed economies—meaning the dividend lasted longer. That's over.
The Female Stabiliser That Disappeared
Albanesi's research on women's employment reveals how profoundly demographic shifts affect not just trend growth but business cycle dynamics. Using Current Population Survey data from 1969-2017 and a quantitative real business cycle model with gender-specific parameters, she demonstrates that female labour force expansion was the primary driver of reduced output volatility during the Great Moderation of 1983-2007.
Male employment is highly cyclical—crashes in recessions, rebounds in expansions. Female employment was less cyclical through the 1970s and 1980s. Women kept entering the labour force even during downturns, especially married women whose husbands had lost jobs. This spousal insurance effect meant household incomes didn't collapse as dramatically during recessions.
As women's share of total hours worked rose from 39 per cent in 1969 to 67 per cent by 1993, this stabilising effect scaled throughout the economy. The standard deviation of GDP volatility dropped roughly 50 per cent after 1983.
Then female participation plateaued around 1997. Women's hours began tracking men's hours across the cycle. When recessions hit after 2000, both earners lost jobs simultaneously. The buffer disappeared.
The jobless recovery phenomenon emerged immediately. The 1991 recession took 31 months for employment to recover. The 2001 recession took 38 months. The 2007-09 crisis took 76 months. GDP bounced back relatively quickly in each case. Employment didn't.
Albanesi's counterfactual simulations show that if female participation had continued growing at 1969-92 rates, the 2001 and 2008 recessions would have been half as deep and recoveries would have taken quarters rather than years. The $2tn in foregone output through 2017 is substantial, but it's nothing compared to the structural weakening going forward.
Every future recession will be deeper. Every recovery will be slower. Every expansion will be weaker. This isn't about policy failures that can be fixed. It's about automatic stabilisers that existed due to demographic transition and have now disappeared because the transition is complete.
The Male Recession
Male labour force participation has fallen from 83 per cent in 1950 to 68.4 per cent as of October 2025. If men were a nation, this would describe the longest, deepest recession in modern economic history.
Manufacturing employed 30 per cent of workers in 1950, 8 per cent today. Technology and outsourcing meant those jobs left permanently. Construction remained volatile and episodic. The comparative advantage men had in physical labour eroded as the economy shifted to services, offices, information work.
The jobs being created don't suit male preferences. Healthcare, education, retail, food service—the growth sectors—are 60-75 per cent female. These roles emphasise interpersonal skills and emotional labour. Many men would rather not work than take jobs they perceive as unsuitable.
Education requirements lengthened, delaying workforce entry. Retirement came earlier. Disability claims rose. The criminal justice system removed millions through incarceration and post-release barriers. Opioids devastated male employment in particular regions.
Each factor contributed modestly. Together they produced persistent decline that shows no sign of reversing. Male participation will likely continue falling as automation eliminates remaining roles where physical capabilities provide advantage. The trend line points toward 60 per cent or below within two decades—levels that would have seemed impossible in 1980.
Aging Into Dependency
Life expectancy rising from 47 years in 1900 to 79 years by 2010 created a massive demographic dividend. Workers spent more of their lives productively employed rather than dying young. The ratio of working-age population to dependents improved steadily through most of the 20th century.
That dividend is reversing. Life expectancy gains have stalled since 2010. More critically, the additional years aren't productive years. They're years of dependency—medical costs, long-term care, retirement benefits—funded by a shrinking ratio of workers.
The numbers are stark. The old-age dependency ratio—people 65 and over per 100 working-age adults—stands at 29 today. The Congressional Budget Office projects it will reach 37 by 2035 and 42 by 2050. In two decades, there will be nearly 30 per cent fewer workers supporting each retiree than today.
The baby boom cohort is retiring. The 65-and-over population will grow from 56m today to 82m by 2040. The working-age population will shrink from 64 per cent to 57 per cent of total population over the same period.
The fiscal implications are severe but the macroeconomic implications are worse. Consumption patterns shift toward healthcare and away from productive investment. Savings rates fall as retirees draw down assets. Capital formation slows. Resources that could fund productivity improvements instead flow to eldercare.
Japan provides the preview. Aging population, shrinking workforce, low productivity growth, persistent deflation, rising debt-to-GDP despite low interest rates. The US enters this transition from a weaker starting position—lower labour force participation, worse dependency ratios, less social cohesion.
Immigration Shutdown at the Worst Time
Immigration provided roughly 40 per cent of US labour force growth from 1990-2020. That flow has slowed dramatically under successive administrations. Both parties now embrace restrictive immigration policies. The business community has largely accepted the new reality. Public opinion shows sustained majorities favouring reduced immigration.
This represents a fundamental break from American history. The US maintained relatively open immigration for two centuries despite periodic restrictionist episodes. That openness was crucial to labour force growth. It's ending precisely when demographic need is greatest.
The fertility decline compounds this. Birth rates have fallen from 3.7 children per woman in 1960 to 1.62 in 2023—the lowest rate on record according to CDC data. This isn't temporary. Fertility has declined across all developed economies for structural reasons related to urbanisation and the economic opportunity costs of childbearing.
Without immigration, the US working-age population will shrink in absolute terms within a decade. With current immigration levels, it will grow only slightly. Either way, the labour force expansion that powered two centuries of growth has stopped.
America Loses Its Edge
Other developed economies face similar challenges, but the US has lost the demographic advantages that once made it exceptional. Labour force participation data from the OECD reveals a remarkable reversal: America now lags its peers.
As of the second quarter of 2025, Japan's labour force participation rate for the working-age population (15-64) stands at 79.5 per cent. Germany's is 79.8 per cent. The United States is at 75.0 per cent.
This data is crucial. Japan and Germany—both known for aging demographics and supposed economic stagnation—now extract more labour from their populations than America does. The demographic exceptionalism that powered two centuries of US dominance is gone.
European countries achieved gender parity in employment earlier and maintained it better. Their welfare states are more expensive but their labour markets keep more people employed. Their dependency ratios are worse but their institutional capacity to manage aging is stronger.
Japan has sustained productivity growth despite demographic decline through aggressive automation and capital deepening. Its labour force is older and smaller but more productive. Its economy has stagnated in absolute terms but per capita performance has been respectable.
China faces a demographic cliff—the one-child policy's consequences hitting all at once—but from a position of much lower per capita income. Its growth will slow dramatically but substantial catch-up potential remains.
The US faces demographic decline from a position of already disappointing productivity growth, already low labour force participation, and already weak institutional capacity. The combination suggests American economic dominance will continue eroding not through dramatic collapse but through steady relative decline.
Automation Accelerates
The demographic dividend exhaustion arrives precisely as automation accelerates in both physical and intellectual labour. This timing isn't coincidental. Employers face rising labour costs and declining labour availability. Automation becomes economically viable at thresholds that previously weren't justified.
The International Federation of Robotics reported record robot installations in the United States in 2022—over 40,000 new units. This wasn't just traditional manufacturing automation. Growth concentrated in logistics, food service, and healthcare—precisely the service sectors that absorbed displaced manufacturing workers and where women's employment concentrated.
Manufacturing automation has been ongoing for decades. That's why manufacturing output has remained relatively stable even as employment collapsed from 30 per cent to 8 per cent of the workforce. The remaining jobs require high skills and command premium wages. Low-skill manufacturing employment isn't returning.
The new development is automation of intellectual and service work. Large language models can perform legal research, draft documents, write code, analyse data. Computer vision can review medical images, inspect products, monitor facilities. Advanced algorithms can make lending decisions, approve insurance claims, process transactions.
Transportation faces imminent transformation. Long-haul trucking employs millions, primarily men without college degrees. Autonomous vehicles will eliminate most of those jobs within two decades. The employment effects will concentrate precisely among demographics already experiencing participation decline.
Retail and food service—sectors that absorbed workers displaced from manufacturing—now face automation pressure. Self-checkout systems, automated warehouses, delivery robots, AI customer service. These technologies are economically viable today and deployment is accelerating.
Healthcare and education—sectors where women concentrated—face slower automation but not immunity. Telemedicine, AI diagnostics, automated record-keeping, remote monitoring all reduce labour requirements. Education moves online with automated tutoring and assessment.
This isn't speculation. It's observable in corporate investment patterns and employment trends. The jobs being eliminated aren't being replaced by equivalent opportunities. Labour force participation falls because available jobs don't justify the opportunity cost of working.
The productivity gains from automation aren't appearing in the data because they're being offset by demographic drag. Nonfarm business productivity averaged 3.0 per cent annual growth from 1996-2005. That fell to just 1.5 per cent from 2010-2019. Labour productivity should be rising as routine tasks get automated. Instead it's stagnating because the workforce is aging, participation is falling, and capital formation is constrained by resources flowing to dependency support.
The Business Cycle Transformed
The expiration of demographic dividends fundamentally changes business cycle dynamics in ways that monetary and fiscal policy cannot offset.
Recessions hit harder because automatic stabilisers have weakened. When female participation was rising, household income remained more stable during downturns. That's gone. When male participation was high, employment rebounded quickly in expansions. That's gone. When the working-age population was growing, labour supply could expand to meet demand. That's gone.
Recoveries take longer because there's no pool of workers waiting to enter employment. The unemployed during recessions increasingly leave the labour force permanently. Participation falls during recessions and doesn't recover during expansions.
Expansions are weaker because demographic constraints limit how much the economy can grow. The potential growth rate—the speed at which the economy can expand without generating inflation—has fallen from 3-4 per cent in the post-war decades to 1.8 per cent according to Congressional Budget Office projections for 2024-2034. Most of that decline reflects demographics, not policy choices.
The policy responses—quantitative easing, near-zero rates, massive fiscal stimulus—reflect attempts to compensate for structural weakening. But monetary policy can't create workers. Fiscal policy can support demand but can't restore automatic stabilisers. The tools available to policymakers are less effective against demographic headwinds.
Corporate behaviour has adapted. Firms expect sluggish recoveries and plan accordingly. They're quicker to cut headcount in downturns, slower to rehire in expansions, more aggressive about automation investments. This behaviour reinforces the jobless recovery dynamic.
Financial markets price in higher volatility and slower trend growth. Equity valuations incorporate expectations of persistent labour constraints. Asset allocators reduce exposure to labour-intensive sectors and increase positions in technology and automation.
The Epicentre Shifts
For two centuries, America was the world's growth engine. The economy that was 18 per cent of world GDP in the early 19th century reached 30 per cent by the late 20th. That dominance rested on demographic advantages that no longer exist.
The epicentre of global economic activity has been shifting east for two decades. That shift will accelerate. Not because Asia has better demographics—most of Asia faces worse demographics than the US. But because the US demographic dividend was so large and has now reversed so completely that the relative position cannot hold.
Japan and Germany now have higher labour force participation than America. Their economies extract more labour from aging populations than the US does from a younger one. The institutional capacity to manage demographic decline exists elsewhere. It doesn't exist here.
The US is not collapsing. It's not facing crisis. It's facing something more mundane and more permanent: steady erosion of relative position. The economy will continue growing, just much more slowly than it did from 1800 to 2000. Other economies will grow more slowly too, but America's demographic advantages that produced two centuries of hypergrowth are gone.
What Comes Next
The $2tn in foregone output that Albanesi measures through 2017 is trivial compared to what the next several decades look like. That figure captures only the impact of stalled female participation, and only through 2017. It doesn't include male participation decline, which has removed 11m workers from the labour force. It doesn't include immigration restriction, which has reduced labour force growth by roughly 40 per cent. It doesn't include the aging impact, which will worsen dramatically as boomers fully retire and the dependency ratio climbs from 29 today to 42 by 2050.
More importantly, it measures what has already been lost. The bigger story is what won't be gained going forward. The hypergrowth that America experienced from 1800 to 2000 was contingent on demographic dividends that have expired. That growth isn't coming back.
Potential GDP growth has fallen from 3-4 per cent in the post-war era to 1.8 per cent today according to Congressional Budget Office projections. That doesn't sound dramatic—a couple percentage points. But compounded over decades, the difference is enormous. At 3 per cent growth, an economy doubles every 24 years. At 1.8 per cent growth, it takes 39 years. The difference between 3 per cent and 1.8 per cent growth over a generation is the difference between transformative prosperity and stagnation.
The lived experience will be persistent disappointment. Asset prices will grow more slowly. Wages will stagnate. Household formation will decline. Geographic mobility will fall. Social mobility will decrease. Each generation will be marginally less prosperous than the previous one, not dramatically worse but never better.
The fiscal situation will deteriorate steadily. Social Security and Medicare commitments were made assuming robust economic growth and favourable dependency ratios. Neither assumption holds. The gap between commitments and resources will widen. Benefits will be cut or taxes will rise or debt will accumulate, but there's no path that avoids painful adjustment.
Corporate profit margins will compress. Labour-intensive sectors will struggle as labour costs rise relative to productivity. Capital-intensive sectors will face slower demand growth as consumer spending power weakens. The record profit margins of the 2010s will be remembered as an aberration, not a new normal.
The Structural Reality
Albanesi's research makes explicit what aggregate data implies: the Great Moderation wasn't about policy sophistication. It was about demographics. The jobless recovery phenomenon isn't a puzzle. It's the predictable consequence of demographic dividend exhaustion.
The economy that emerges is structurally weaker across every dimension. More volatile because automatic stabilisers have weakened. Slower-growing because labour inputs are stagnating and productivity growth has fallen to 1.5 per cent. Less productive because resources flow to dependency rather than investment. More unequal because labour's bargaining power depends on scarcity that automation prevents from emerging.
This isn't a temporary condition awaiting better policy. It's structural reality reflecting the exhaustion of growth sources that powered two centuries of expansion. The demographic dividends that made America an economic superpower have expired.
The labour force cannot grow through incorporating previously excluded groups—women's participation is at 57.2 per cent and men's is at 68.4 per cent, with both trending down. It cannot grow through extending working lifespans—the dependency ratio climbs from 29 today to 42 by 2050. It cannot grow through immigration—political consensus has shifted permanently restrictive and fertility is at a record low of 1.62 births per woman.
Meanwhile automation continues in both physical and intellectual labour, with robot installations hitting record highs. Employers are reducing demand for workers precisely as demographic supply constrains. The employment-to-population ratio will continue falling not because people don't want to work but because the economy needs fewer workers to generate the same output.
Every previous economic slowdown in American history occurred in an economy where labour force growth provided eventual escape velocity. That safety valve has closed. The hypergrowth era is over. What comes next looks more like Europe or Japan: low growth, aging populations, persistent disappointment—except America now has lower labour force participation than its peers.
This isn't American decline in the sense of collapse or crisis. It's American decline in the sense of steady erosion of relative position. The economy will continue growing at 1.8 per cent rather than 3-4 per cent. Other economies will grow slowly too, but America's demographic advantages that produced two centuries of hypergrowth are gone.
The research exists. The data exists. The structural reality is measurable. What doesn't exist is any plausible mechanism for recreating the demographic dividends that powered American ascendance. They're gone. The hypergrowth era was unique and unrepeatable. This time genuinely is different.